
Satellite image processing has become an essential tool in our modern world, fundamentally changing how we observe and analyze the Earth. From tracking environmental changes to managing natural disasters, satellite imagery provides crucial insights that help us make informed decisions. In this blog, we’ll explore the fundamentals of satellite image processing, its various applications, and walk through a practical Python example to illustrate its capabilities.
Key Applications of Satellite Image Processing
Environmental Monitoring:
Satellite images help track deforestation, monitor glacier retreats, and observe changes in land cover. These insights are crucial for understanding climate change and developing strategies for conservation.
Disaster Management:
During natural disasters like hurricanes, earthquakes, and floods, satellite imagery provides real-time data to aid in rescue operations and coordinate relief efforts. This information helps assess the extent of damage and identify the most affected areas.
Agriculture:
Farmers and agronomists use satellite data to monitor crop health, predict yields, and manage water resources more effectively. By analyzing spectral data, satellite images can reveal details about soil moisture, plant health, and pest infestations.
Urban Planning:
Urban planners use satellite imagery to study land use, track urban sprawl, and plan infrastructure development. High-resolution images provide detailed views of cities, helping planners make informed decisions about zoning and public services.
Defense and Security:
Governments and defense agencies use satellite images for surveillance, intelligence gathering, and border monitoring. These images can detect troop movements, track illegal activities, and provide situational awareness in conflict zones.
Example: Analyzing Water Bodies with Python
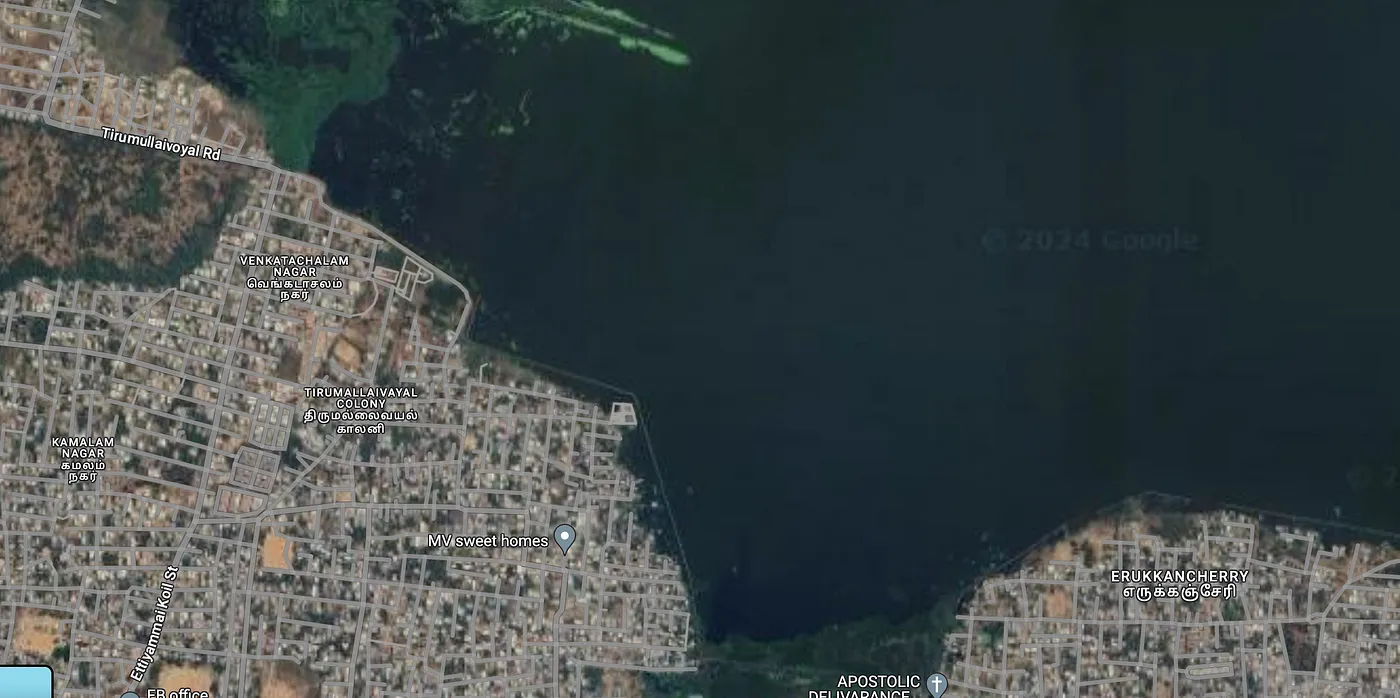
To illustrate the power of satellite image processing, let’s dive into a simple Python example using libraries like OpenCV and scikit-image. We will use a sample satellite image to detect water bodies, demonstrating how easily accessible tools can provide powerful insights from satellite data.
I have used OpenCV, an open-source library that helps do various operations and manipulations on video and images. Click here to learn more about OpenCV.
Step-by-Step Guide
-
Install Required Libraries:
First, ensure you have the necessary Python libraries installed. You can install them using pip:
pip install numpy opencv-python scikit-image matplotlib
-
Load and Preprocess the Image:
Load a satellite image and convert it to grayscale to simplify the analysis. Grayscale images reduce computational complexity and make it easier to apply algorithms.
We obtained the image from Google Maps, which shows the area near Erukkancherry. and the lake is Puzhal Lake.
import cv2
import numpy as np
import matplotlib.pyplot as plt
# Load the satellite image
image = cv2.imread('waterboday.jpg')
# Convert the image to RGB (OpenCV uses BGR by default)
image_rgb = cv2.cvtColor(image, cv2.COLOR_BGR2RGB)
# Convert to grayscale
gray_image = cv2.cvtColor(image_rgb, cv2.COLOR_RGB2GRAY)
# Display the grayscale image
plt.imshow(gray_image, cmap='gray')
plt.title('Grayscale Satellite Image')
plt.axis('off')
plt.show()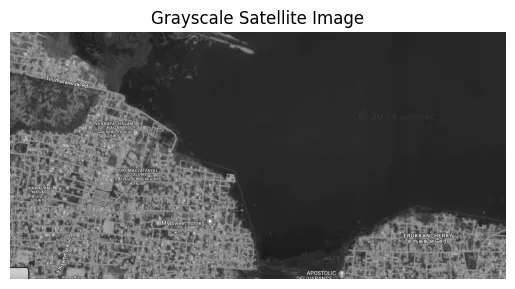
-
Apply Thresholding to Detect Water Bodies:
Apply a threshold to the grayscale image to detect water bodies. Setting a pixel intensity threshold can highlight water areas, which are typically darker.
blurred_image = cv2.GaussianBlur(gray_image, (5, 5), 0)
# Apply a binary threshold to the grayscale image using Otsu's method
_, thresholded_image = cv2.threshold(blurred_image, 0, 255, cv2.THRESH_BINARY_INV + cv2.THRESH_OTSU)
# Display the thresholded image
plt.imshow(thresholded_image, cmap='gray')
plt.title('Thresholded Image (Water Detection)')
plt.axis('off')
plt.show()
-
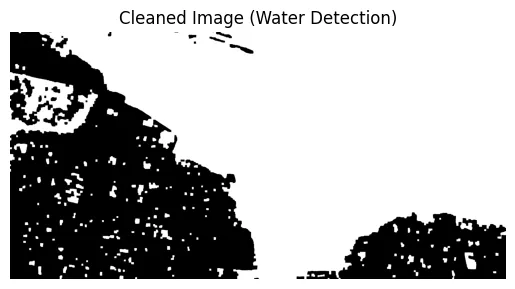
Apply Morphological Operations to Clean Up the Image:
Morphological operations like erosion and dilation help remove noise and improve the detection of water bodies. These operations enhance the quality of the thresholded image.
# Define a kernel for morphological operations
kernel = np.ones((5, 5), np.uint8)

# Apply opening (erosion followed by dilation) to remove small noise
opened_image = cv2.morphologyEx(thresholded_image, cv2.MORPH_OPEN, kernel, iterations=2)

# Apply closing (dilation followed by erosion) to close small holes inside the objects
closed_image = cv2.morphologyEx(opened_image, cv2.MORPH_CLOSE, kernel, iterations=2)

plt.imshow(closed_image, cmap='gray')
plt.title('Cleaned Image (Water Detection)')
plt.axis('off')
plt.show()
-
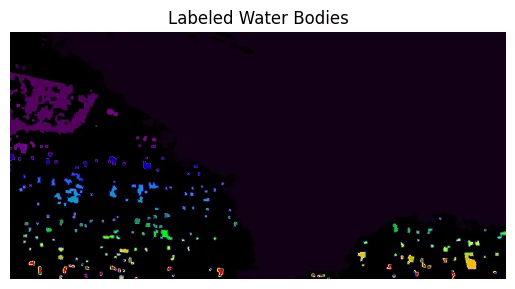
Label and Count Water Bodies:
Use connected component analysis to label and count the number of water bodies in the image. This step helps quantify features and analyze spatial patterns.
from skimage.measure import label,regionprops
# Label connected components
labeled_image = label(closed_image)

# Display the labeled image
plt.imshow(labeled_image, cmap='nipy_spectral')
plt.title('Labeled Water Bodies')
plt.axis('off')
plt.show()

# Count the number of water bodies
num_water_bodies = len(regionprops(labeled_image.astype(int)))
print(f'Number of detected water bodies: {num_water_bodies}')
-
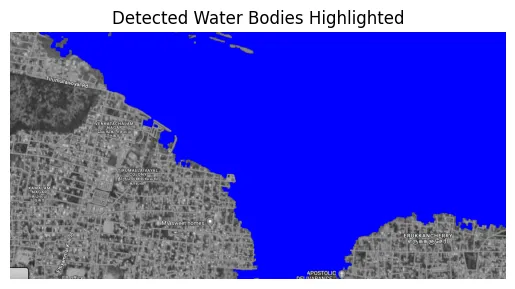
Highlight Water Bodies:
Highlight the detected water bodies by filling their regions with a blue color.
# Ensure labeled_image is of a float or integer type compatible with plt.imshow
labeled_image = labeled_image.astype(np.float32)
# Copy the original image to draw on
imagecopy =cv2.cvtColor(gray_image, cv2.COLOR_BGR2RGB)
min_area_threshold = 300000
# Loop through each detected region and highlight it if it meets the area threshold
for region in regionprops(labeled_image.astype(int)):
    if region.area >= min_area_threshold:
        # Create a mask for the region
        region_mask = np.zeros_like(gray_image)
        for coord in region.coords:
            region_mask[coord[0], coord[1]] = 255
        # Highlight the region on the original image
        imagecopy[region_mask == 255] = [0, 0, 255]  # Highlight with blue color


# Display the image with circles around water bodies
plt.imshow(imagecopy)
plt.title('Detected Water Bodies Highlighted')
plt.axis('off')
plt.show()
Conclusion
Satellite image processing is a transformative tool that provides valuable insights into the Earth’s surface. By using Python and libraries like OpenCV and scikit-image, we can perform basic image processing tasks to analyze satellite images effectively. This example focused on detecting water bodies, but the same techniques can be adapted for various types of analysis, such as vegetation monitoring, urban planning, and disaster management.
